

U.S. Corporate Earnings Have Grown Nearly 14-Fold Since 1990, Far Ahead of the Rest of the World
• From trending topic: U.S. Companies' Earnings Surge 14-Fold Over 35 Years, Outpacing Global Rivals
Summary
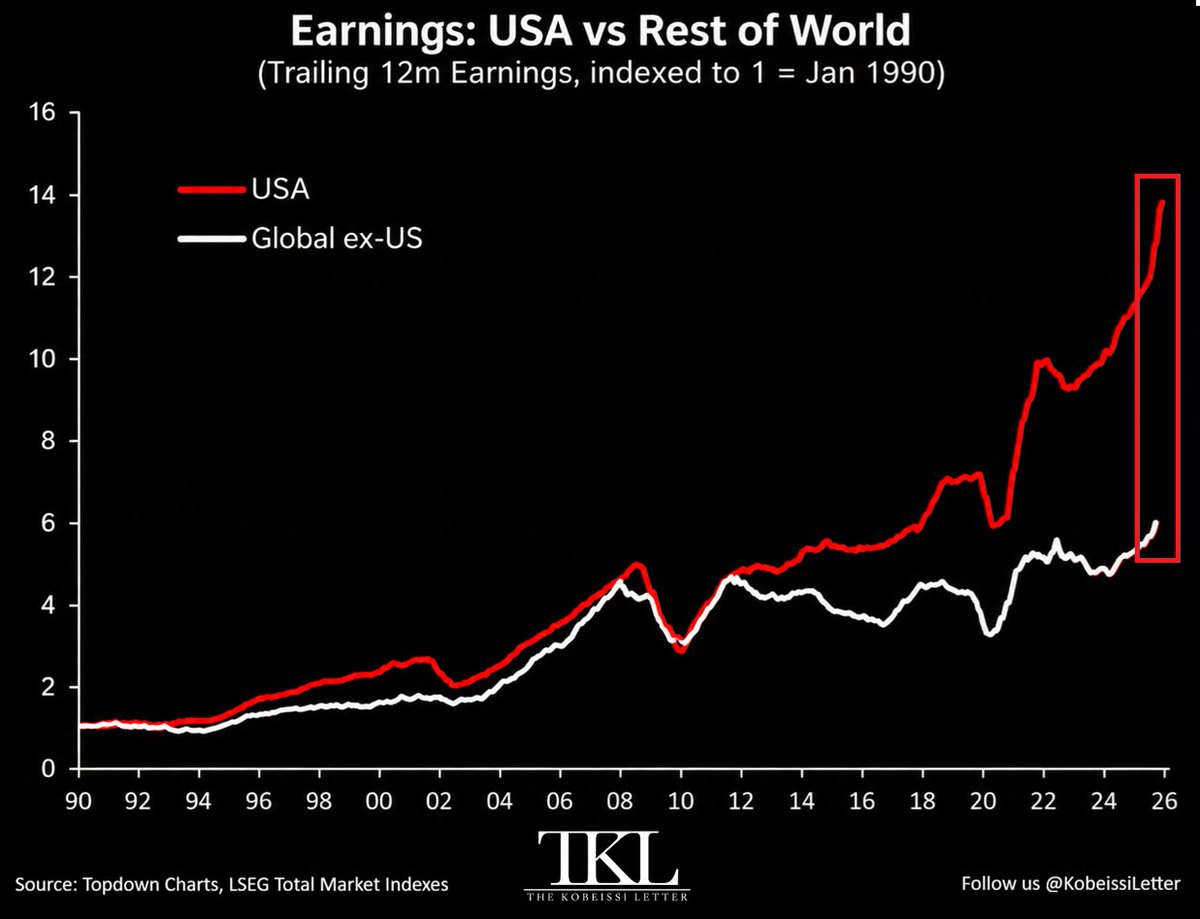
Investors circulating charts this week are treating a long divergence as a fresh fact. Data cited from Topdown Charts and LSEG show trailing 12-month earnings of U.S. listed companies up nearly 1,300 percent since 1990 — about 14 times their level 35 years earlier. Earnings of companies outside the United States rose about 500 percent over the same span, or roughly six times. In that reading, U.S. profits grew about 2.6 times as fast as those of the rest of the world, and non-U.S. earnings showed little lasting lift from the 2008 crisis through 2025.
The figures describe listed-company profits, not GDP or household income. They are being used to explain why global equity wealth has concentrated so heavily in U.S. stocks, and to argue over whether that concentration is a durable advantage or a crowded trade. The underlying series, the index definitions, and the split between a few mega-cap firms and the broader market are not fully specified in the posts driving the discussion; those details matter, and they are not all public in the material now circulating.
Common Perspectives
U.S. outperformance is structural, not a fluke
U.S.-focused equity bulls and some policy commentators treat the 35-year gap as evidence that American firms compound faster because of deeper capital markets, a large domestic consumer base, energy supply, and a cluster of platform technology companies. The view appeals because it turns a portfolio overweight into a story about institutions rather than luck. Its assumption is that those advantages keep compounding. The trade-off is that a backward-looking earnings chart can become an argument against looking at starting valuations, political risk, or the chance that three and a half decades of outperformance are already in the price.
Non-U.S. profits had a lost stretch after 2008 — that is the opportunity
International and value-oriented investors read the same plateau in rest-of-world earnings as the reason foreign stocks look cheap relative to a depressed profit base. If profits outside the United States barely improved for years after 2008 while U.S. earnings soared, mean reversion and diversification become the pitch. The appeal is buying what has been left behind. The assumption is that non-U.S. earnings can recover rather than stay impaired by demographics, energy costs, weaker governance, or industrial structure. The risk is that cheap earnings stay cheap.
The comparison is real but not a clean national contest
Skeptical analysts stress composition. “U.S. companies” in broad equity measures are dominated by a small group of mega-cap technology and communications firms whose customers and profits are global. Buybacks have cut share counts and lifted per-share earnings even when total profits grew more slowly. Sector mix (software-heavy U.S. indexes versus bank-, energy-, and industrial-heavy indexes abroad), the dollar, and different accounting conventions all blur a simple flag-versus-flag scoreboard. This view appeals to people who accept the direction of the data but reject the moral. Its limit is that caveats can explain part of a 1,300-versus-500 gap without explaining all of it.
Policy shocks, not destiny, opened the gap
A more political reading points to Europe’s energy shock, China’s property and regulatory squeeze, Japan’s long period of weak nominal growth, and the U.S. mix of shale, large fiscal support, and an early lead in generative AI. It appeals because it offers concrete causes instead of culture. The assumption is that different choices could narrow the gap. The trade-off is that some of those conditions — aging, China’s leverage, Europe’s energy mix — change slowly, so “policy” can become a synonym for problems that markets will not reverse on a convenient timetable.
A Different View
The argument scores countries as if listed earnings were a trophy for national economic health. A large share of profits booked by U.S.-listed firms is earned from customers, plants, and intellectual property outside the United States. The chart may say as much about which legal homes, listing venues, and currency captured global surplus as about whose domestic economy produced it. A 1,300 percent rise in corporate earnings can also sit beside weaker gains in median real wages or fiscal room. The investment story (who owned the claims on those profits) and the political story (who lived with the distribution) are not the same, and the circulating charts collapse them into one line.
Conclusion
The next useful test is narrower than the 35-year scoreboard: whether trailing earnings outside the United States finally turn up from the post-2008 plateau, and whether a handful of U.S. firms keep accounting for most of the gap. Those two facts will shape the next decade of allocation more than the last three.
Sources and discussion
These public posts were collected while researching this story. They provide context and reactions, but may not independently verify every claim.
View the original topic on XMacro Alpha
@MacroAlphaHQ
US EARNINGS HAVE GROWN 2.6 TIMES FASTER THAN THE REST OF THE WORLD SINCE 1990. US companies posted nearly 1,300 percent earnings growth. Global ex-US earnings rose just 500 percent over the same span, with no material improvement from 2008 through 2025. Investors still holding
Sep 22, 20263 likes1 repostsEvan | Odd Macro
@OddMacro
🇺🇸 US corporate earnings exceed 14x 1990 levels: Dominance over global competitors reaches record highs!. Latest data from Topdown Charts & LSEG highlights an expanding divergence in Trailing 12m Earnings growth between US equities and the Rest of the World (Global ex-US). The
Sep 22, 20261 likesThe Kobeissi Letter
@KobeissiLetter
The gap between US earnings growth and the rest of the world has never been wider: Earnings of US companies have grown nearly +1,300% since 1990. By comparison, earnings of global companies excluding the US have risen +500% since 1990. In other words, US earnings growth has
Sep 22, 20264.2K likes703 reposts